
Meteorological data
Air temperature and precipitation during the barley growing season varied in the years of study. In 2021, significantly lower temperatures were observed from April 21 to May 10 than in 2022. However, the first year of the study was warmer than the second in the periods from June 1 to 20 and from July 1 to 20 (Fig. 2). Particularly stressful weather conditions were observed in the last two ten-day periods of April 2021, in which the air temperature at the ground during the emergence period dropped to −7.0 °C (Fig. 2). The same period in 2022 was characterized by temperatures ranging from − 2.1 to 6.2 °C.
The total amount of rainfall from March to July 2021 was 208.5 mm, and in 2022, during the same period, the total amount of rainfall was 131.7 mm. In both years of the study, little rainfall was observed during the emergence period (the total rainfall in March 2021 was 21.4 mm, and in 2022 only 0.5 mm). The period from April 21 to May 31, 2022, was also characterized by a small amount of rainfall (25.4 mm), coinciding with the tillering and the beginning of shooting. In 2021, during this period, the total rainfall was 75.5 mm. Low rainfall in both years of the study was also observed at the end of the ripening stage.
Atmospheric conditions and the Selyaninov coefficient during the study period.
Leaf area index (LAI)
Regardless of sowing density and genotype, the leaf area index (LAI) of barley in the BBCH 35 stage was significantly higher in 2021 than in 2022 and ranged from 3.2 to 4.8. In 2022, the values of this index did not exceed 2.8. In 2021, barley leaf area was significantly differentiated by the interaction of genotype and sowing density (Fig. 3). Increasing the sowing density from 250 grains m−2 to 450 grains m−2 resulted in a significant increase in the leaf area (LAI) of H. v. var. rimpaui by 45.5%. Increasing the sowing density from 400 to 450 grains m−2 did not result in a further increase in LAI; on the contrary, even a slight downward trend was observed. In the first year of the study, a similar reaction to increasing sowing density was also shown by H. v. var. nigricans. LAI at the sowing density of 400 and 450 grains m−2 was significantly higher than at 250 and 300 grains m−2. In 2022, the tested genotypes did not significantly respond to LAI to increasing sowing density.
In the BBCH 57 stage, the interaction of study year, genotype and sowing density also significantly influenced the leaf area index. In this stage, no large differences between the years of study were observed, as in BBCH 35. H. v. var. rimpaui in both 2021 and 2022 was characterized by significantly higher LAI values at a sowing density of 300 grains m−2 than at a sowing density of 400 grains m−2. In turn, H. v. var. nigricans in 2022 in the BBCH 57 stage was characterized by significantly higher LAI at a sowing density of 450 grains m−2 than at a sowing density of 250 grains m−2. In 2021, sowing density had no significant effect on the leaf area index of H. v. var. nigricans.
The relationships of experimental treatments are confirmed by the polynomial regression curve, which in H. v. var. rimpaui in 2021 indicates a significant increase in the LAI value in BBCH 35 when the sowing density is increased from 250 to 350–400 grains m−2, and then its decrease when the sowing density is further increased to 450 grains m−2 (Fig. 4). In 2022, no significant relationships were found between sowing density and the LAI value of this genotype. In H. v. var. nigricans, the LAI value in BBCH 35 increased with increasing sowing density from 250 to 450 grains m−2 in both 2021 and 2022.
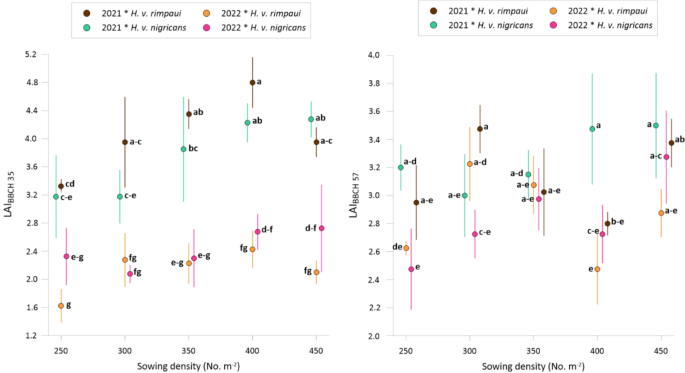
Leaf Area Index (LAI) of H. v. var. nigricans and H. v. var. rimpaui at subflag leaf stage (BBCH 35) and heading stage (BBCH 57). Error bars indicate standard deviation (SD). Letters a-g – mean values followed by different letters indicate significant differences p < 0.05.
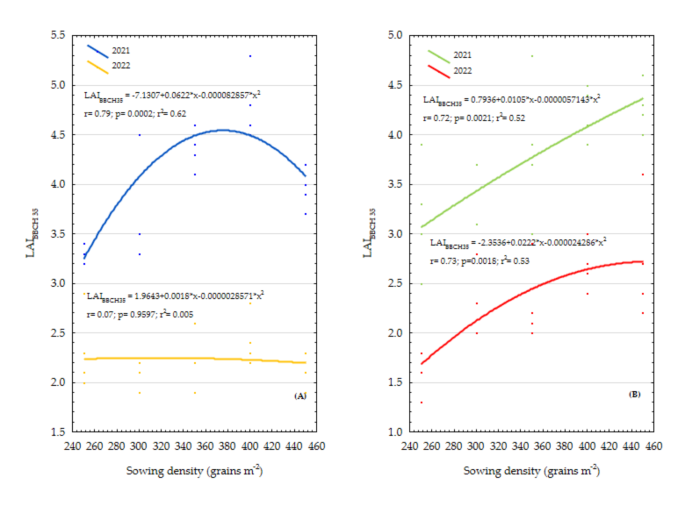
Relationships between sowing density and leaf area index (LAI) in stage BBCH 35 of H. v. var. rimpaui (A) and H. v. var. nigricans (B).
SPAD value
In 2022, regardless of the sowing density, H. v. var. nigricans in the BBCH 35 stage was characterized by a significantly higher SPAD value than in 2021, and also compared to H. v. var. rimpaui in both years of the study In 2022, regardless of the sowing density, H. v. var. nigricans in BBCH 35 was characterized by a significantly higher SPAD value than in 2021, and also compared to H. v. var. rimpaui in both years of the study. In no year of the study was there any significant effect of sowing density on the leaf greenness index of the tested genotypes. In turn, the interaction of the year of research, genotype and sowing density significantly impacted a fall in BBCH 57 (Fig. 5). In 2022, increasing the sowing density of H. v. var. nigricans from 250 to 350 grains m−2 significantly reduced the SPAD index in the analyzed development stage. Still, this index increased dramatically with a further increase in the sowing density from 350 to 400 and 450 grains m−2.
In 2021, no significant differences in the mean SPAD value were observed between genotypes. In 2022, at a sowing density of 350 grains m−2H. v. var. rimpaui was characterized by a significantly higher SPAD compared to H. v. var. nigricans, while in contrast, at a sowing density of 450 grains m−2H. v. var. nigricans showed higher SPAD values than H. v. var. rimpaui.
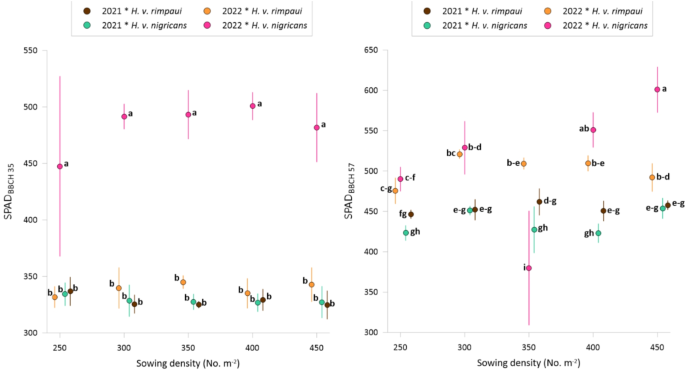
SPAD value of H. v. var. nigricans and H. v. var. rimpaui at subflag leaf stage (BBCH 35) and heading stage (BBCH 57). Error bars indicate standard deviation (SD). Letters a-h – mean values followed by different letters indicate significant differences p < 0.05.
Regression analysis did not confirm significant relationships between sowing density and SPAD value for H. v. var. rimpaui nor H. v. var. nigricans in 2021 (Fig. 6). However, in 2022, a significant non-linear relationship between sowing density and SPAD value in BBCH 57 was observed for both genotypes. In H. v. var. rimpaui with increasing sowing density from 250 grains m−2 to 350 grains m−2, an increase in SPAD value was observed, which remained at a similar level at sowing densities of 350–370 grains m−2 and then decreased with the rise in sowing density. In 2022, H. v. var. nigriacans also showed a significant relationship between sowing density and SPAD value. The regression curve showed a downward trend in this parameter as the sowing density increased from 250 to 300 grains m−2, followed by relatively constant SPAD values at 300–350 grains m−2 density. Then, there was an increase as the sowing density increased above 350 grains m−2.
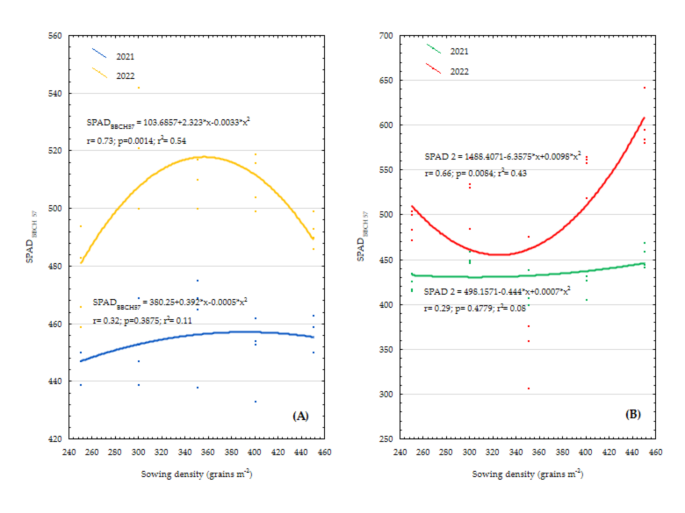
Relationships between sowing density and leaf chlorophyll index (SPAD) in stage BBCH 57 of H. v. var. rimpaui (A) and H. v. var. nigricans (B).
Chlorophyll fluorescence
ABS/RC
The ABS/RC index in the flag leaf stage, on average for the genotype and sowing density, was significantly higher in 2021 than in 2022. A significant interaction effect of the year of the study, genotype and sowing density on selected chlorophyll fluorescence indices was also observed (Fig. 7). In 2021, the highest ABS/RC value in H. v. var. rimpaui was observed at a sowing density of 300 grains m−2. It was significantly higher than at densities of 250, 400 and 450 grains m−2. In 2022, this genotype was characterized by significantly higher ABS/RC at sowing densities of 300 and 350 grains m−2 than at 250 and 400 grains m−2. However, a further increase in the sowing density from 400 to 450 grains m−2 resulted in a sudden rise in ABS/RC to significantly higher than at densities of 250, 300, and 400 grains m−2.
H. v. var. nigricans in 2021 with increasing sowing density from 250 to 300, 350 and 400 grains m−2 kept ABS/RC at a similar level. However, increasing the sowing density from 400 to 450 grains m−2 resulted in a significant decrease in ABS/RC concerning all tested sowing densities. In 2022, expanding the sowing density of H. v. var. nigricans from 250 grains m−2 to 300, 350, and 400 grains m−2 resulted in a significant reduction in the ABS/RC index of the flag leaf. However, increasing the sowing density from 400 to 450 grains m−2 caused ABS/RC to rise again and was significantly higher than at 400 grains m−2.
Significant differences between genotypes were observed at sowing densities of 250, 350, and 400 grains m−2 in 2021 and at 250 grains m−2 in 2022, where H. v. var. nigricans was characterized by higher ABS/RC values than H. v. var. rimpaui.
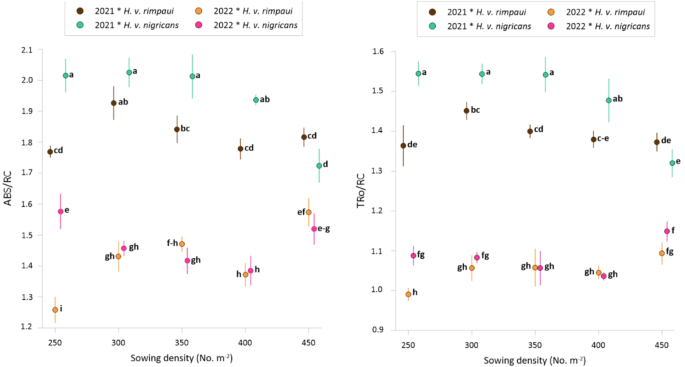
ABS/RC and TRo/RC indicators of H. v. var. nigricans and H. v. var. rimpaui at heading stage (BBCH 57). Error bars indicate standard deviation (SD). Letters a-h – mean values followed by different letters indicate significant differences p < 0.05.
TRo/RC
Regardless of sowing density and genotype, significantly higher TRo/RC values were observed in 2021 than in 2022. Significant differences between the tested treatments also resulted from the interaction of the study year, genotype, and sowing density.
H. v. var. rimpaui in 2021 was characterized by the highest TRo/RC value at a sowing density of 300 grains m−2. TRo/RC was significantly higher at this sowing density than at 250 and 450 grains m−2. In 2022, TRo/RC for H. v. var. rimpaui increased substantially due to increasing the sowing density from 250 grains m−2 to 300, 350, 400, and 450 grains m−2. At the highest sowing density, TRo/RC for H. v. var. rimpaui also had a significantly higher value than sowing densities of 300, 350, and 400 grains m−2.
In 2021, the TRo/RC in H. v. var. nigricans at a sowing density of 450 grains m-2 was significantly lower than at the other sowing densities tested. In the second year of the study, however, the TRo/RC index in this genotype at the highest of the densities tested was significantly higher when compared with densities of 350 and 400 grains m-2.
In 2021, a significantly higher value of TRo/RC was observed for H. v. var. nigricans compared to H. v. var. rimpaui at sowing densities of 250, 300, 350, and 400 grains m−2. In 2022, the same significant relationship was observed only at a density of 250 grains m−2. At the highest tested sowing density of 450 grains m−2, the values of TRo/RC were equal for the tested genotypes in both years of the study.
DIo/RC
In 2021, increasing the sowing density of H. v. var. nigricans from 250 grains m−2 to 300, 350, and 400 grains m−2 did not cause significant changes in the DIo/RC value (Fig. 8). However, at a sowing density of 450 grains m−2 a substantial decrease in DIo/RC was observed compared to a sowing density of 400 grains m−2. In 2022, H. v. var. nigricans also achieved the highest DIo/RC value at a density of 250 grains m−2. A significant reduction in the DIo/RC was observed by increasing the sowing density from 250 to 300, 350, 400, and 450 grains m−2.
In 2021, H. v. var. rimpaui did not show significant changes in DIo/RC under the influence of increasing sowing density, whereas H. v. var. rimpaui responded to this factor in 2022. A significant increase in DIo/RC was observed due to the increase in sowing density from 250 grains m−2 to 300 and 350 grain m−2. However, saving H. v. var. rimpaui at a density of 400 grains m−2 caused a significant decrease in the DIo/RC value compared to the density of 350 grains m−2. Then a further increase in the sowing density from 400 to 450 grains m−2 caused another increase in DIo/RC to significantly higher than at densities of 250, 300 and 400 grains m−2.
In both years of the study at a density of 250 grains m−2H. v. var. nigricans was characterized by significantly higher DIo/RC than H. v. var. rimpaui; these differences decreased and were insignificant at higher sowing densities.
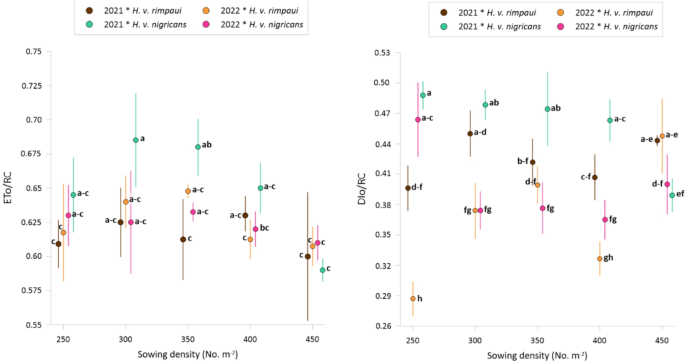
Eto/RC and Dio/RC indicators of H. v. var. nigricans and H. v. var. rimpaui at heading stage (BBCH 57). Error bars indicate standard deviation (SD). Letters a-h – mean values followed by different letters indicate significant differences p < 0.05.
ETo/RC
H. v. var. nigricans in 2021 was characterized by a significant reduction in ETo/RC due to the increase in sowing density from 300 to 350 grains m−2 to 450 grains m−2 (Fig. 8). However, no significant effect of increasing sowing density on ETo/RC was confirmed in H. v. var. rimpaui in 2021 and 2022 and in H. v. var. nigricans in 2021. ETo/RC did not differ significantly between genotypes and years of the study. In 2021, at a density of 350 grains m−2, H. v. var. nigricans was characterized by a significantly higher value of the ETo/RC ratio than H. v. var. rimpaui.
FV/FM
The FV/FM index of the tested barley genotypes was not significantly differentiated by sowing density in 2021 (Fig. 9). In 2022, H. v. var. rimpaui responded with a significant reduction in FV/FM to increase sowing density from 250 grains m−2 to 350 grains m−2. However, a further increase in sowing density from 350 to 400 grains m−2 resulted in a significant rise in FV/FM. At a sowing density of 450 grains m−2, FV/FM decreased again and was significantly lower than at 250 and 400 grains m−2. In 2022, at a sowing density of 250 grains m−2, H. v. var. rimpaui showed significantly higher FV/FM than H. v. var. nigricans. At higher sowing densities, no significant differences in FV/FM values were observed between the tested genotypes.
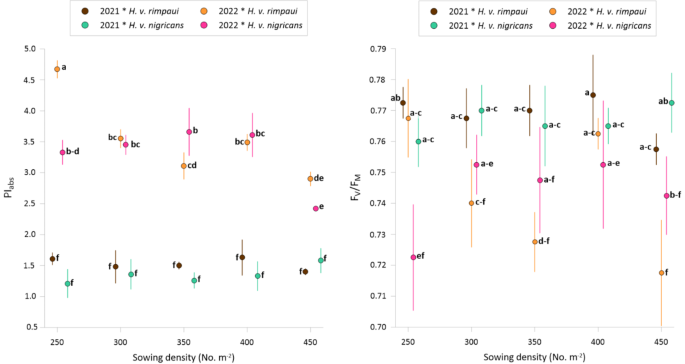
FV/FM and PIabs indicators of H. v. var. nigricans and H. v. var. rimpaui at heading stage (BBCH 57). Error bars indicate standard deviation (SD). Letters a-f – mean values followed by different letters indicate significant differences p < 0.05.
PIabs
In 2022, the tested barley genotypes, on average for sowing density, showed significantly higher PIabs values than in 2021 (Fig. 9). Also, the study year, genotype, and sowing density interaction significantly impacted the PIabs index value. However, the response of the tested genotypes to increasing sowing density was observed only in 2022. H. v. var. rimpaui had the highest PIabs at a sowing density of 250 grains m−2. Increasing the sowing density to 300, 350, 400, and 450 grains m−2 resulted in a significant decrease in the PIabs value compared to a density of 250 grains m−2. H. v. var. rimpaui sown at a density of 450 grains m−2 also showed significantly lower PIabs than 300 and 400 grains m−2 densities.
PIabs for H. v. var. nigricans in 2022 at sowing densities of 250, 300, 350, and 400 grains m−2 remained at a similar level. Increasing the sowing density to 450 grains m−2 resulted in a significant decrease in PIabs compared to 250, 300, 350 and 400 grains m−2 densities.
In 2022, H. v. var. rimpaui was characterized by significantly higher PIabs compared to H. v. var. nigricans at a sowing density of 250 grains m−2, at higher sowing densities, the differences between the genotypes decreased and were not significant.
The regression equation (Fig. 10) also indicates no significant response of H. v. var. rimpaui in terms of PIabs to increasing sowing density in 2021, and a significant decrease in PIabs observed when increasing the sowing density of this genotype in 2022. H. v. var. nigricans, however, showed a significant relationship between sowing density and PIabs in both 2021 and 2022. In 2021, a small but significant increase in PIabs was observed with increasing sowing density. In 2022, this relationship was different because an increase in PIabs was recorded with an increase in the sowing density from 250 to 300 grains m−2, maximum values for sowing densities of 300–350 grains m−2, and then a decrease in the value of this index with a further increase in sowing density above 350 grains m−2.
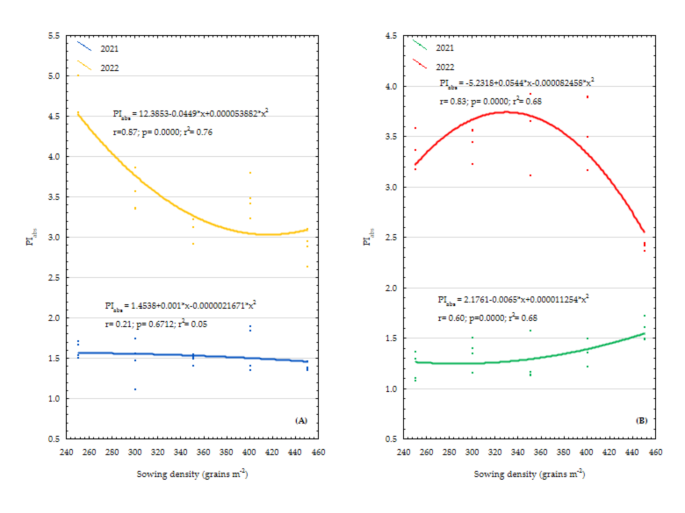
Relationships between sowing density and PIabs of H. v. var. rimpaui (A) and H. v. var. nigricans (B).
Grain yield per plant
A higher grain yield per plant was observed in 2021 compared to 2022, although this depended on the interaction year of study with genotype and sowing density (Fig. 11). In the first year of the study, an increase in the sowing density of H. v. var. rimpaui from 250 to 350, 400 and 450 grains m⁻² resulted in a notable reduction in grain yield per plant. Furthermore, H. v. var. nigricans exhibited a diminished yield per plant, though this was only evident following an increase in the seed from 250 to 350 grains m−2 to 400 and 450 grains m−2. In the range of 250 to 350 grains m−2, the grain yield of H. v. var. nigricans was found to be similar.
In 2022, no significant response was observed in the tested genotypes to sowing density (Fig. 11).
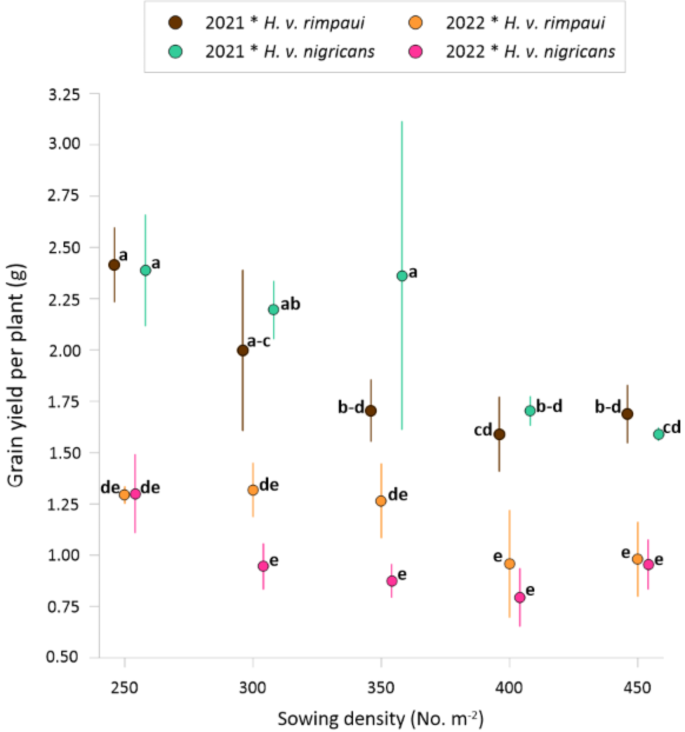
Grain yield per plant of H. v. var. nigricans and H. v. var. rimpaui. Error bars indicate standard deviation (SD). Letters a-e – mean values followed by different letters indicate significant differences p < 0.05.
Analysis of relationships between traits
Pearson’s linear correlation analysis showed a significant positive correlation between LAI at BBCH 35 and BBCH 57 and the Fv/Fm, ABS/RC and TRo/RC indices, and a negative correlation with PIabs (Table 1). A significant positive correlation was also observed between LAI at BBCH 35 and BBCH 57 and DIo/RC in H. v. var. rimpaui. This correlation was not confirmed in H. v. var. nigricans. The LAI and chlorophyll indexes (SPAD) were negatively correlated in both tested genotypes. H. v. var. rimpaui showed a robust significant interaction between LAI in BBCH 35 and SPAD in BBCH 57, while H. v. var. nigricans was characterized by a strong correlation between LAI in BBCH 35 and SPAD in BBCH 35. The strength of these interactions was significantly higher at the BBCH 35 stage, while it decreased at the BBCH 57 stage. A significant positive correlation was observed between grain yield per plant and the indices Fv/Fm, ABS/RC. Furthermore, a strong positive correlation was evident between grain yield per plant and TR/RC. Additionally, a significant negative correlation was identified between grain yield and SPAD and PIabs.
